Map view display options
Map Settings
You can change basemaps, toggle between 2D and 3D data views, view 3D terrain if supported by the data, and optimise the image quality and map quality for your computer.
Map View
Map view lets you toggle between 3D terrain, 3D smooth and 2D. Default view is 2D which shows a vertical map view with north to the top. To visualise data in 3D, select the 3D terrain or 3D Smooth view. The map settings include Show terrain and Image optimisation only in 3D mode.
Select 3D Smooth to show a perspective view which has no elevation change. The maps or images are draped over a smooth globe.
Select 3D Terrain to show a perspective view with an interpretation of the elevation changes in the terrain.
Basemap
The basemap can help find places of interest, provide context and satellite imagery. There are several different basemaps to choose from. If you are finding locations of interest, you may prefer to see aerial imagery with place labels or the roads basemap. If you are exploring landscapes, you may find aerial imagery without labels or natural earth rendering most useful. For analysis or to explore other data which you have added to the map viewer you may prefer the more understated basemaps positron (light) or dark matter.
Why cannot I see the basemaps on display?
Basemap is only visible when there are no loaded raster layers on the display. By default, Total Vegetation cover layer is preloaded. To hide the layers, click the white box in the navigation pane next to each layer.
Which basemap should I choose?
Make sure a 2D basemap option is selected when using analysis tools to generate cover reports for a polygon or region or to minimise computer memory use.
3D basemaps provide a more realistic globe display however these use more memory than 2D basemaps. 3D Terrain maps require the use of a current browser and WebGL supported graphics cards. Zooming in with 3D Terrain perspective view can provide a detailed exploration of the landscape.
Select a 2D basemap by:
- See the basemap by removing all map layers from display
- click the white box in the navigation pane next to each layer
- each layer now shows a hollow box next to the legend.
- Click Map settings on Map viewer
- Click 2D top right
- Choose a 2D basemap. The selected basemap shows a blue border, a tick in the top right corner and shows in the map viewer.
- To close the map selector, click the x in the top right of the map selector
Timeline
Do not activate the Timeline from the Map Settings Timeline box. A timeline Always show check box will appear in the Map settings window if 3D smooth or 3D terrain Map View are selected. Do not check on this box. This is a known bug and is not compatible with the RaPP map data layers or analysis tools. If you have switched this on and need to remove it, refresh your browser and re-open RaPP map using a 2D basemap (see Basemap).
To use a timeline, to display different available times for a data layer, select the use timeline button (Figure 3) in the Workbench/Navigation pane. See section View timeline for more information.
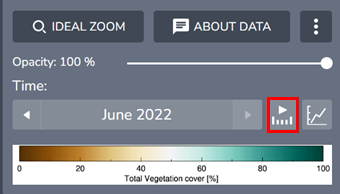
Image Optimisation & Raster map Quality
You can move the quality slider or select the native resolution to be able to visualise high intensity datasets on your machine.
Gyroscope
When in 3D mode, click gyroscope in the centre of the Compass Control (picture above) and drag slowly upwards to tilt the view into a Perspective View. Drag downwards to tilt the view back to vertical. The further you drag, the faster it tilts. Release the mouse button when you reach the desired view.
Double-click the gyroscope in the centre of the Compass Control to return the view quickly to a vertical view with North to the top at the current location and scale. See Map navigation and display – Terria Platforms User Guide for more information.
Zoom
Click the + (plus) icon for zoom in, + (minus) for zoom out and house icon for default view display.
To zoom to the extent of a data layer shown in the Map View find the layer legend in the Workbench and click Ideal Zoom.
Compare
(YouTube video link: 3. Workbench - YouTube)
The compare function is useful to show two different data layers side by side, or two different time points of the same data layer.
To use Compare function first make sure the Map View is on 2D mode. Compare and timelines do not work using 3D Terrain or 3D smooth basemaps. See Basemap for more information about basemaps.
The compare function can be launched in two ways
- Using the Compare button on the right of the map viewer (Compare different layers), OR
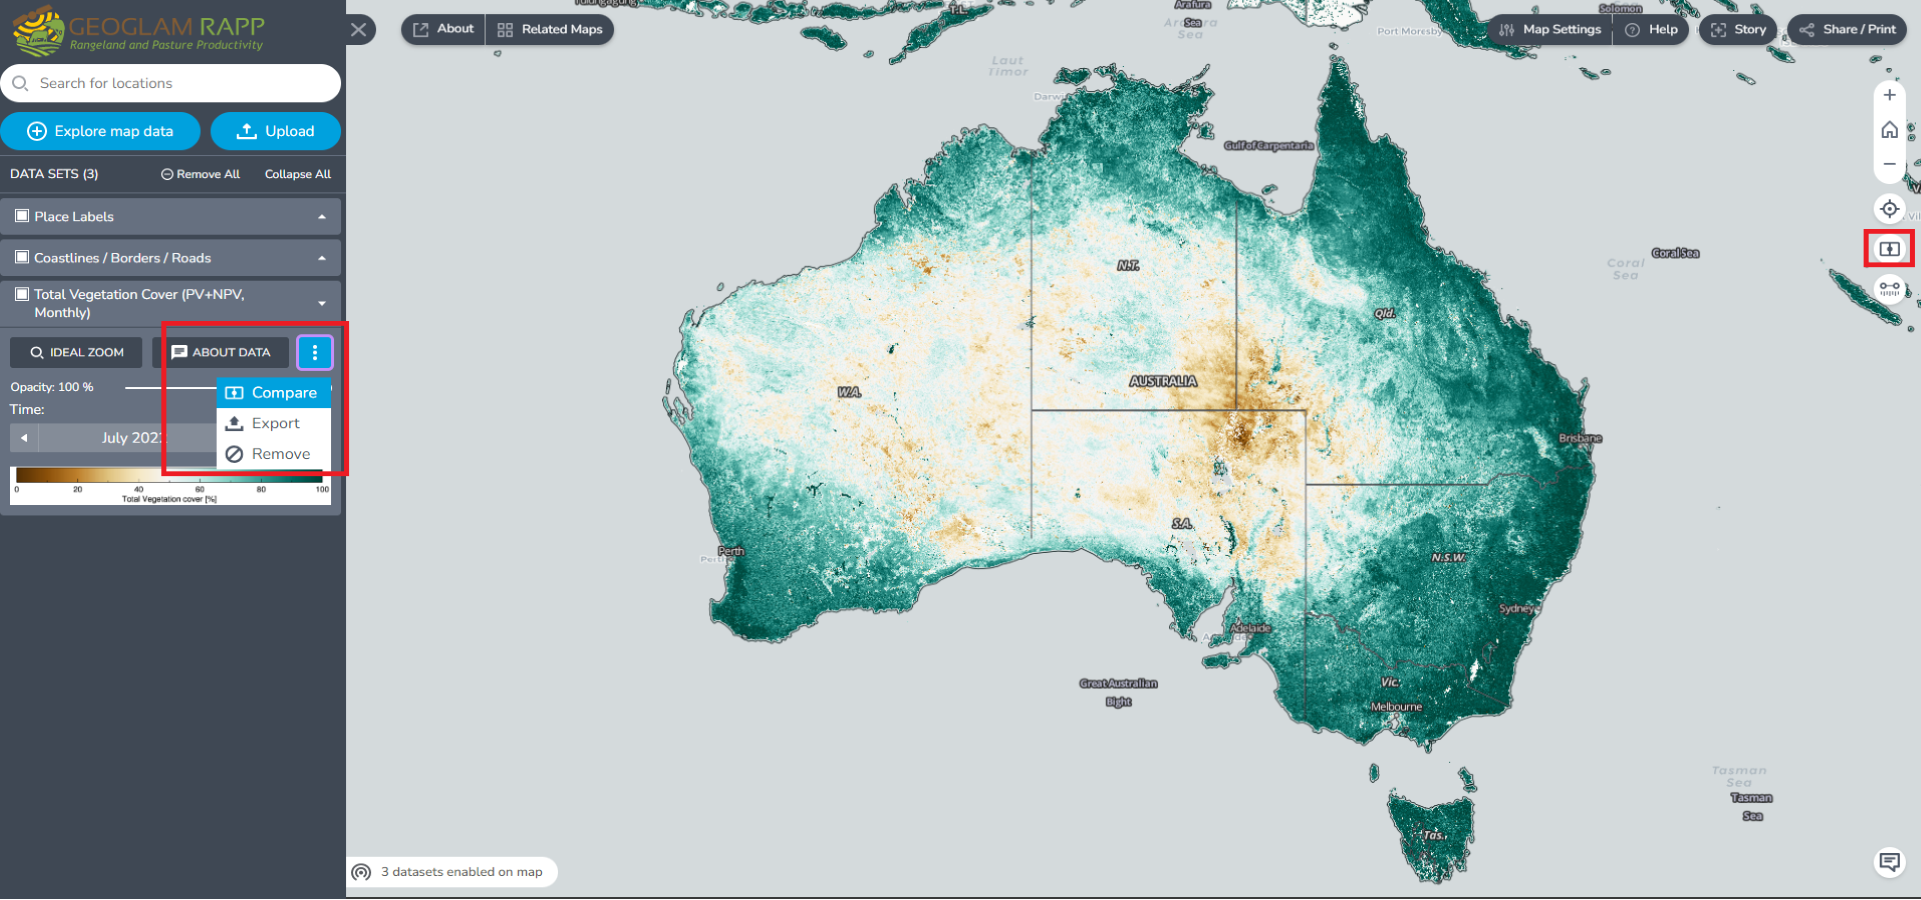
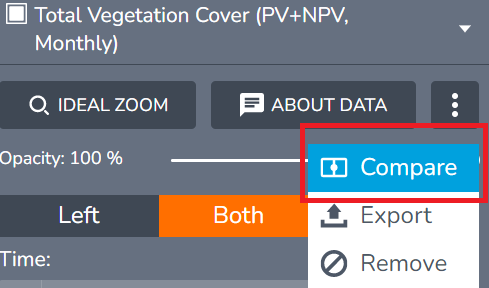
- Using the Compare button for a single data layer containing multiple time periods. Access this option in the Workbench legend for your chosen data layer. Expand the legend and click the three dots next to About data to find this option. (Compare imagery from different dates).
Compare Different Layers
You can display and compare two different layers, e.g., view the Total Vegetation Cover for January 2022 and Vegetation Cover Deciles for January 2022
-
Remove/ deselect all unwanted layers and make sure Map View is on 2D mode. You can either add your data layers of interest first or activate compare first. In this example we will activate compare and then add the data layers.
-
Click the compare button on the right-hand side of the map viewer (Figure 5). Hovering over this button should expand the symbol to read "Compare" with a hover-over tooltip which reads "Enable side by side comparison between two sets of data". Clicking this Compare button will split the Map viewer display. Once it is activated, the compare button will turn into blue colour with a X sign next to it.

-
Add a layer. e.g., Total Vegetation Cover layer (PV+NPV, monthly) for January 2022 as described in Add and remove data and layers.
-
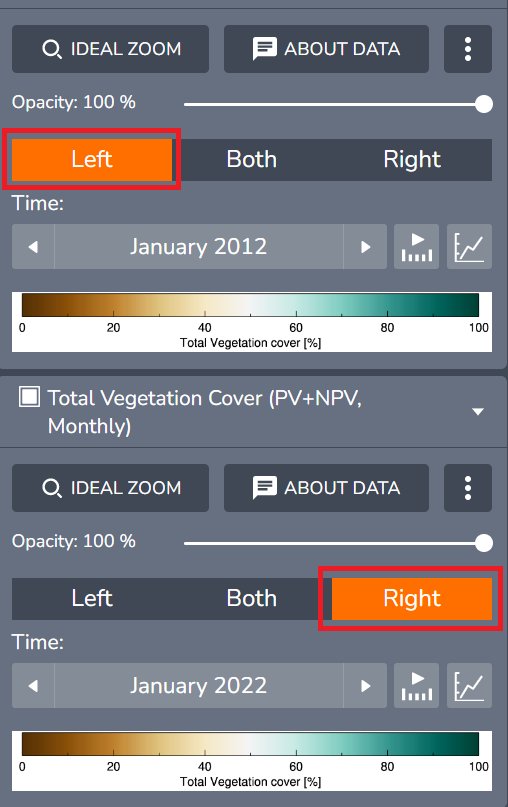
When the Compare button is active for each data layer in the Workbench you will see a new option to control whether each data layer is displayed on the left, right or both sides of the screen split: Left will show the chosen layer on the left side, Both on both sides, and Right on the right side. Figure 6 shows the legend item for total vegetation cover with the split screen active and Both selected to show Total Vegetation cover on both sides of the split screen.

-
Click Left or Right to view the data layer on only one of the two sides of the split screen to enable comparison.
-
Add a new layer, e.g., Vegetation Cover Deciles (Explore map data < Australia < Vegetation Cover (MODIS, 500 m) < Monthly < Vegetation cover deciles (Monthly), click +. For more information about adding layers refer section Add data and layers. Click Right on the direction boxes.
-
Once the layer is added, select the date e.g., “January 2022”
-
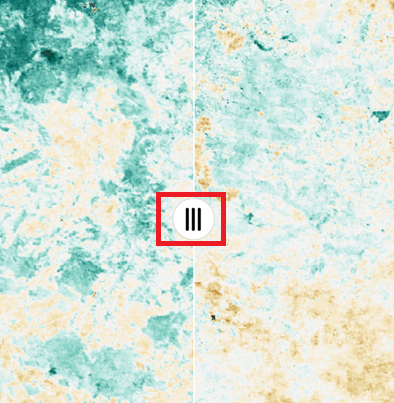
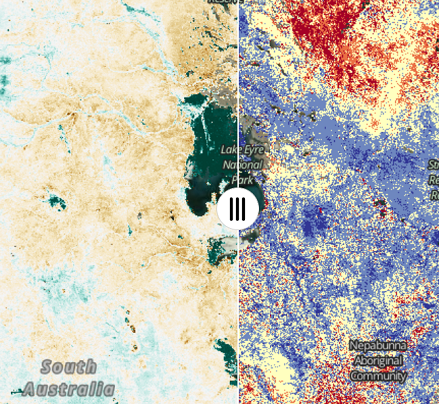
Drag the slider icon (with three vertical lines on a white circle) in the middle of the split line left or right to adjust the views.
Compare Imagery from Different Dates
To display two different times for the same layer; e.g. view the Total Vegetation Cover for January 2012 and January 2022 you will use the compare – duplicate and show splitter option.
-
Add the Total Vegetation Cover layer (PV+NPV, monthly). If the layer is already loaded by default, you can now see a new line of boxes with Left, Both and Right inside the layer window.
-
Below the Total Vegetation Cover, on the right-hand side, there is a show more action button with three vertical dots next to About data. Click this button and then click compare. This will add a duplicate layer of Total vegetation Cover.

-
Note: ONLY click Compare once else you will get multiple copies of the layer
-
Select different time periods for the two layers (section Data with multiple dates)
-
Then on the duplicate Total Vegetation Cover layer (PV+NPV, monthly) layer, do the same and select another time (you want to compare to) e.g. “January 2022”
-
Once you selected the two periods of time to compare, select Left from the direction boxes for the first total vegetation layer (January 2012) and Right for the second layer (January 2022).
-
Now the first layer (January 2012) and second layers (January 2022 will be displayed on left and right sides on the display. You can drag the slider icon (with three vertical lines on a white circle) in the middle of the split line left or right to adjust the views.
-
To remove the compare mode on the map, Click the X to close/ remove the compare mode next to the compare button.
Pedestrian mode
Pedestrian mode is not recommended for use with fractional cover data or when doing any analysis in Rapp Map. It only works only on 3D mode. You can turn on Pedestrian mode by clicking the pedestrian icon. Pedestrian mode is intended to allow you to navigate and view 3D terrain data from a pedestrian perspective. To exit pedestrian mode and reset the view to the extent of the whole of Australia either click the Home icon in the zoom tools, or press the refresh button in your browser which will also reset the data layers.
Line Measure
Line measure helps you to measure the distance in kilometers between two or multiple points or locations on the map view. You can measure by activating the tool, clicking on one point on the map and then another.
Feature information
The feature information window allows you to find out more information about data at any chosen location. You can click on a pixel and find out the latitude, longitude, and values for visible data layers at that location.
The feature information window will pop-up when you click anywhere on the map. This window shows for the selected pixel:
- the layer names for the data layers displayed on the map viewer which have information available for the pixel on which you have clicked
- the values for fields in each data layer the Latitude and Longitude
To use the feature information window:
- Toggle between feature information from each data layer using the arrows to the right of each layer name on the feature information window, to show and hide information from each layer. The viewer will only show information from one layer at a time.

- Layers appear in the order in the Workbench/ Navigation pane.
- Download information for the pixel from a data layer as a JSON file by clicking ‘Download this table’
- Close the feature information by clicking the x at the top right of the pop-up window.
Why does the feature information say No data is available here?
You may have no data layers displaying or you have clicked outside the extent of these layers. See Add and remove layers from the map viewer.