Analysis tools
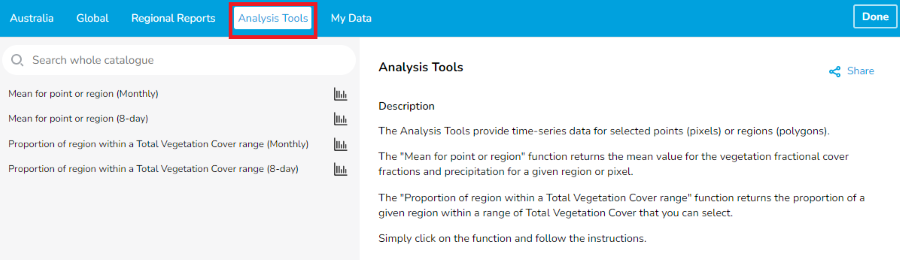
The Analysis tools provide time-series analysis for the area of interest (selected points or polygons) of Fractional and Total Vegetation cover types (MODIS, 500 m) from Jan 2001 to current. To use analysis tools, click Explore map data and select Analysis Tools (Figure 41).
Analysis tools offer more flexibility than the regional reports, as you can analyse timeseries patterns of Total Vegetation Cover for your custom polygons or points.
There are four types of time series analysis tools available (Figure 41)
- Mean for point or region (Monthly)
- Mean for point or region (8-day)
- Proportion of region within a Total Vegetation Cover range (Monthly)
- Proportion of region within a Total Vegetation Cover range (Monthly)
For more information about these tools see Mean for point or region and Proportion of region within a Total Vegetation Cover range.
The Proportion of region within a Total Vegetation Cover range analysis tool is based on the same concept as the Frequency of total vegetation cover data which can be found in the data catalogue window, Australia, Vegetation Cover (MODIS, 500m), Summaries. However, the analysis tool enables you to set your own threshold values and to perform time series analysis for your own points or polygons. See Proportion of region within a Total Vegetation Cover Range for more information.
Analysis tool geometry inputs
(YouTube video link: 6. Using the Analysis Tools - YouTube)
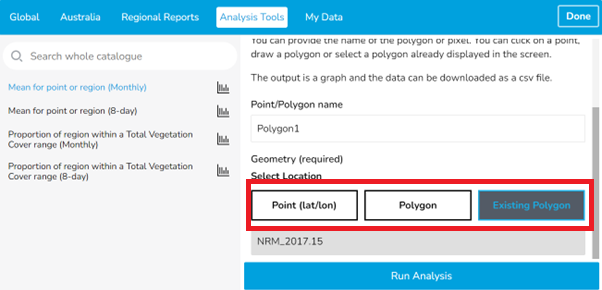
Time series analysis can be performed using a vector geometry point or polygon. You can either use an inbuilt polygon dataset from the Rapp tool, use your own prepared point or polygon files or you can draw one. Figure 42 shows the Analysis tool window with the choice of three Geometry inputs; Point (lat/lon), Polygon, and existing polygon.
To use an inbuilt polygon dataset layer for analysis:
- Load a polygon layer
- Click Explore map data, select Australia, select a polygon dataset layer and add it to the map view. For example expand boundaries, cadastre, click + to add QLD cadastral parcels
- Navigate to the polygon of interest in the map view
- Hide other layers
- Open analysis tools (Explore map data, Analysis tools tab)
- Select the analysis tool you want to use (See Mean for point or region or Proportion of region within a Total Vegetation Cover Range)
- Select Existing polygon
- Select a single polygon from the polygon layer displayed in the RaPP map view
- Check the polygon ID has been added from the Existing polygon layer to the grey box below the Existing Polygon
- Enter a Point / polygon name. This will be the label shown on the chart in RaPP and CSV file.
- Click Run Analysis
Use your own prepared point or polygon files
- Drag and drop your file into RaPP map (See How to upload data and My polygons).
- Hide other layers
- Open analysis tools (Explore map data, Analysis tools tab)
- Select the analysis tool you want to use (See Mean for point or region or Proportion of region within a Total Vegetation Cover Range)
- Select Existing polygon
- Select a single polygon from the polygon layer displayed in the RaPP map view to analyse and run the analysis.
Draw a new Point (Lat/Lon) or Polygon.
- Hide other layers to see the basemap (or other context needed to locate your area of interest)
- Navigate to your area of interest (Search for location)
- Open Analysis tool (Explore map data, Analysis tools tab)
- Click point or polygon – This will take you to the map screen.
- For a point, click on the map to select a pixel/point.
- For a hand-drawn polygon, Click on the map to select the starting point of the polygon. Click at each vertex. Click again the starting point to finish the polygon. Click done to close the pop-up drawing window
See the Mean for point or region or Proportion of region within a Total Vegetation Cover Range for more details about each analysis function.
Mean for point or region
You can display the time series (monthly and 8-day data) of the mean Fractional and Total vegetation cover with rainfall of an area. Fractional cover includes green cover, non-green cover and bare ground. Total vegetation cover is green+non-green.
Mean values can be useful for small areas to summarise the vegetation cover. However, mean values can be misleading and hide variation especially over large areas or time spans. We suggest spatial Total vegetation cover averages are appropriate for areas less than 1 square kilometre depending on the complexity of the landscape. Creating a target based on the average Total vegetation cover from a time series is also problematic because the target will fail half of the time. This is because the mean has roughly half the values above and half below it. Mean values can also be skewed by outlier values.
Mean for point or region (Monthly)
This function returns the mean value for the monthly vegetation fractional cover fractions and precipitation for a given region or pixel.
To use this function,
- Go to Explore map data, select Analysis Tools. Click Mean for point or region (Monthly).
- Select the area of interest (See My data and layers)
- Once the polygon is selected, type name of polygon into Point/Polygon name box
- Click Run Analysis in blue bar on bottom of Analysis Tools page
The results are loaded as:
- Layers into the workbench (navigation pane)
- Click off/on the layers to display what is required on the graph
- Tip - switching off rainfall (click on blue “prec” square button) makes it easier to see other layers and changes the graph display width
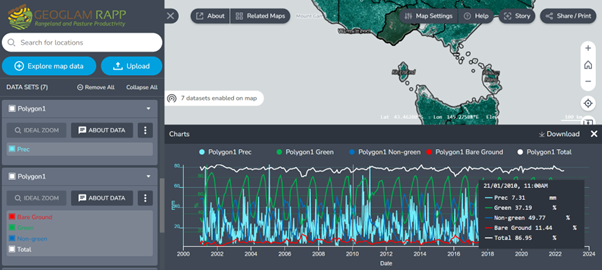
- As a graph on the bottom of the map screen. Hover over the graph to see the change in fractional cover types over the time
- Whatever layers are displayed on the graph can be downloaded as a csv file.
- Click Download on top right hand corner of graph. CSV file is downloaded to your Downloads directory
Mean for point or region (8-day)
This function returns the mean value for the 8-day Fractional and Total vegetation cover with precipitation for a given region or pixel
To use this function,
- Go to Explore map data, select Analysis Tools. Click Mean for point or region (8-day) and follow the same steps as above (2 – 4).
Proportion of region within a Total Vegetation Cover Range
This function returns the proportion of a given region within a range of Total Vegetation Cover (for monthly and 8-days). Total cover is the sum of green and non-green cover.
Proportion of region within a Total Vegetation Cover range (Monthly)
To use this function
- Go to Explore map data, select Analysis Tools. Click Proportion of region within a Total Vegetation Cover range (Monthly).
- Select the area of interest (See My data and layers)
- Once the polygon is selected, type name of polygon into Point/Polygon name box
- Provide the lower and upper limits of total vegetation cover and click Run Analysis.
- The output is added as a layer into the workbench (navigation) pane graph and the data can be downloaded as a csv file.
Proportion of region within a Total Vegetation Cover range (Monthly)
To use this function
- Go to Explore map data, select Analysis Tools. Click Proportion of region within a Total Vegetation Cover range (8-days) and follow the same steps as above (2-5).
Why do analysis tools take a long time to run?
This could be due to the size of the polygon/ polygons you are using. Bigger the polygon the analysis will take more time. Try using smaller polygons to run the tools.
Note: The Regional Reports of comprehensive description of the vegetation cover condition for the most recent month on record for the NRM regions and the LGA Areas of Australia can be found in the Regional Reports tab (See Reports for more information).
Analysis tool outputs
The output of each analysis is a graph or chart. In RaPP Map the colours of the chart series are fixed. Total vegetation Cover (TVC) white, Photosynthetic Vegetation (PV) Green, Non-photosynthetic vegetation (NPV) dark blue, Bare ground is Red and Precipitation is light blue. While you can display charts from multiple analyses in RaPP Map it can be difficult to distinguish results from other points or polygons. For this reason you may prefer to download the results from each analysis as a CSV file by pressing download on the top right of the chart in RaPP map after each analysis.
The CSV file will be labelled with the Polygon/Polygon name you entered (figure 42).
Please ensure to record the details of the analysis you have run such as which analysis tool was selected and which thresholds were chosen as none of these details are recorded in the csv file.
Remove or hide charts or series from RaPP map view using the workbench legend.