|
|
Tour |
CSIRO intro | copyright | queries | user guide | publications | bug info | data
program code | feedback | search | tour | around the world | workshopsCRCCH
|
|
Tour |
CSIRO intro | copyright | queries | user guide | publications | bug info | data
program code | feedback | search | tour | around the world | workshopsCRCCH
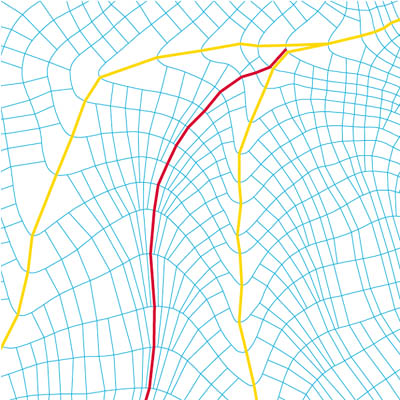
This shows a zoom view of the element network displayed on the last page. You can see more clearly how the flow tubes diverge and converge about ridges (shown by red lines) and valleys (shown by yellow lines), respectively.
OTHER TERRAIN ANALYSIS OUTPUT
raw countour data | digital elevation model contours | boundary calculation | element network
zoom view of element network | aspect | slope | summer radiation
equinox radiation | synthetic hillslopes | topographic indices 1
TOPOG TOUR
last modified onThursday, 29 July 1999