|
|
Tour |
CSIRO intro | copyright | queries | user guide | publications | bug info | data
program code | feedback | search | tour | around the world | workshopsCRCCH
|
|
Tour |
CSIRO intro | copyright | queries | user guide | publications | bug info | data
program code | feedback | search | tour | around the world | workshopsCRCCH
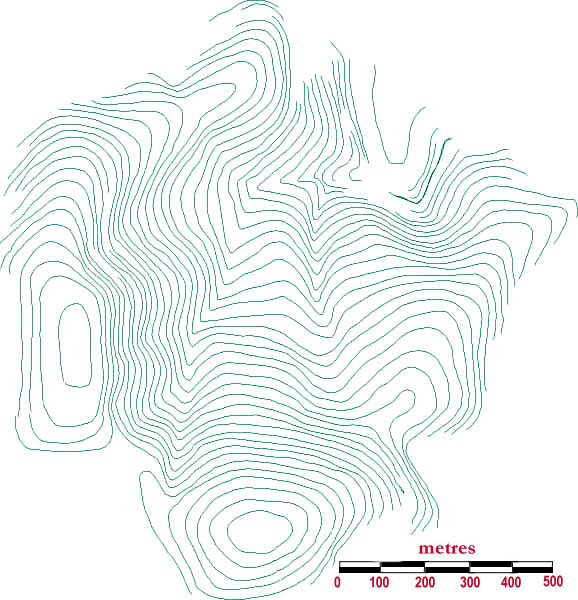
A TOPOG analysis begins with xyz data or raw contours. In this plot we show an example of the latter. These contours were hand digitised from a 1:25000 series topographic map. Note how contours are discontinuous near the catchment outlet.
last modified on