|
|
Tour |
CSIRO intro | copyright | queries | user guide | publications | bug info | data
program code | feedback | search | tour | around the world | workshopsCRCCH
|
|
Tour |
CSIRO intro | copyright | queries | user guide | publications | bug info | data
program code | feedback | search | tour | around the world | workshopsCRCCH
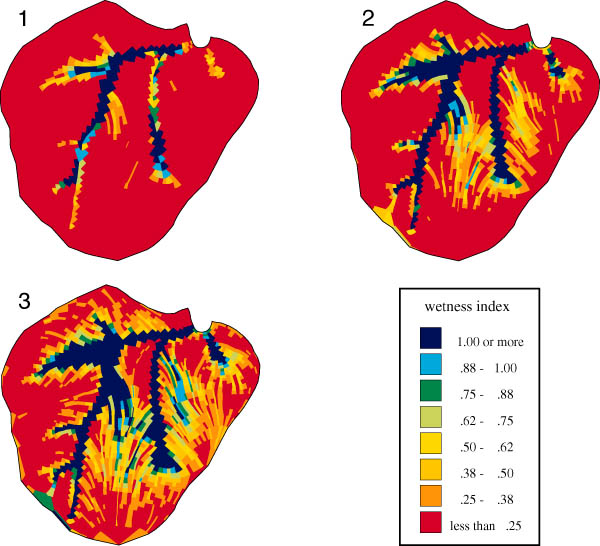
Shown below are three different predictions of the steady-state normal wetness index, defined in equation 4.1 in Chapter 4 of the User Guide and in O'Loughlin (1986). A value of 1 or higher denotes that the element is saturated, ie. the upslope flux of drainage exceeds the capacity of the element to transmit that flux.
In each case it has been assumed that the soil transmissivity is 1 m/d. What is being varied between simulations is the net lateral drainage flux term (q). In simulation 1 q is set at 0.1 mm/d, whereas in simulations 2 and 3 q is set to 0.3 and 0.5 mm/d, respectively.
The percentage of catchment saturated increases from 5.2% for simulation 1, to 11.6% for simulation 2, and 16.0% for simulation 3.
OTHER STEADY STATE BALANCE OUTPUTS
normal wetness index | radiation-weighted wetness index | uniform stream power index
variable stream power index | erosion hazard index | landslide hazard index
shear stress index | sources & sinks
TOPOG TOUR
last modified onThursday, 29 July 1999