The Function buttons in Topog_Xhistog are similar to those in Topog_Profile . A brief description of each button is given below.
Click on the Files button to select a file to display. The first click opens the Files window. Note the currently selected directory in the "Selection" field - it will be the directory from where the program was started. Change the current directory by clicking in the "Selection" field and editing that line, or by selecting from the list in the "Directory" field. In the "Files" field will appear a list of files found in the selected directory. Click on the required file and note that it appears in the "Selection" field following the directory. The Filter button provides the option of changing the default .atr filter to determine the list in the "Files" field. Once the selected file is correct, click OK for the selection to take effect, then Cancel to clear the Files window. When this has been done the chosen file will appear in the selection area of the menu window.
| Example 1 |
The user wants to select a (.wet) file to display. |
 |
Press Files button in menu window. |
 |
Files window is opened |
|
|
Change the default filter in the top filter editing box to *.wet and click on the Filter button at the bottom of the dialog box. |
|
All *.wet files will be displayed in the "Files" field. |
|
|
Select a .wet file from the list in the "Files" field. |
|
Filename will be displayed in the "Selection" field. |
|
|
Press Cancel. |
|
Filename will be displayed in the Files Selected area of the menu window. |
|
The Style window provides two options for displaying the data: Line and Filled (the default style). Select the appropriate style then Cancel to clear the window.
| Example 2 |
The user wants to select "Line" style. |
|
Press Style button. |
|
Opens Style window. |
|
|
Press Line button then Cancel. |
|
Data currently displayed in the active frame will appear in line format. |
|
A popup window will appear listing the data fields that may be displayed. The available parameters that may be displayed will be file type dependant as explained earlier. Select the parameter to be displayed and click OK, and the data will appear in the top left frame of the display screen. Note the red square in the bottom left corner of this frame. This marker selects which plot frame is "active". Select another frame by moving the mouse pointer to anywhere within the desired frame and click. Note the marker will move to the bottom left corner of that frame.
Use the Select button again and the data will now be displayed in the new "active" plot frame. Note that you can only display one data set per plot frame.
When displaying histograms, you have the option of displaying the values in each class as:
- Number
Each bar in the histogram will represent the actual number of values which fall within that class.
- Cumulative
Each bar in the histogram will represent the cumulative total of the number of values in that class, and in the classes less than that class.
- Frequency
Each bar in the histogram will represent the relative number of values in that class as a fraction of the total number of values. Thus the value will be between 0 and 1.
- Polygon
The histogram will be displayed as a sequence of connected points instead of bars. The value of each point in each class will be the number of values in that class as a fraction of the total number of values, and hence will be a value between 0 and 1.
An example of the four options for displaying histogram values is given in figure 9.2
click on the image below for a bigger and more clearer version
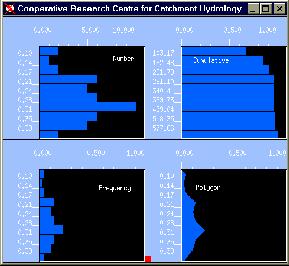 |
| Figure 9.2
| The four options available when displaying histogram values. |
| Example 3 |
The user wants to display wetness index from a .wet file. |
|
Press Select button. |
|
Select window is opened. |
|
|
Select "Wetness Index" from the list of data types, then click OK, then Cancel. |
|
Data will be displayed in the active plot frame. |
|
Click on the desired colour from the Colours window to change the colour of the displayed data in the active plot frame (as denoted by the red marker).
| Example 4 |
The user wants to change the colour of the displayed data. |
|
Press Colours button |
|
Colour selection window is opened. |
|
|
Click on required colour, then click Cancel. |
|
Data displayed in active frame will change to the selected colour. |
|
Adds text (entered by the user) to any frame. The first click brings up the Annotate window. To enter new text click in the Type here window then OK when done. Use the mouse pointer to locate the text in the correct frame. Click in the "Font" field to change font type and size of the selected text. To dismiss the Annotate window click Cancel. The appearance of the selected font can be previewed by clicking Sample.
| Example 5 |
The user wants to add text to a plot. |
|
Press Annotate button. |
|
Annotate window is opened. |
|
|
Click in "Type here" field and enter required text. |
|
Select size and style from "Font" field. |
|
Click Sample to view a font example. |
|
Locate cursor at required postion and click. |
|
Text appears on plot. |
|
|
Click Cancel when finished. |
|
Clears any data currently displayed but does not remove any text added with Annotate.